
John Smith
Jan 10, 2025

Inventing the Future
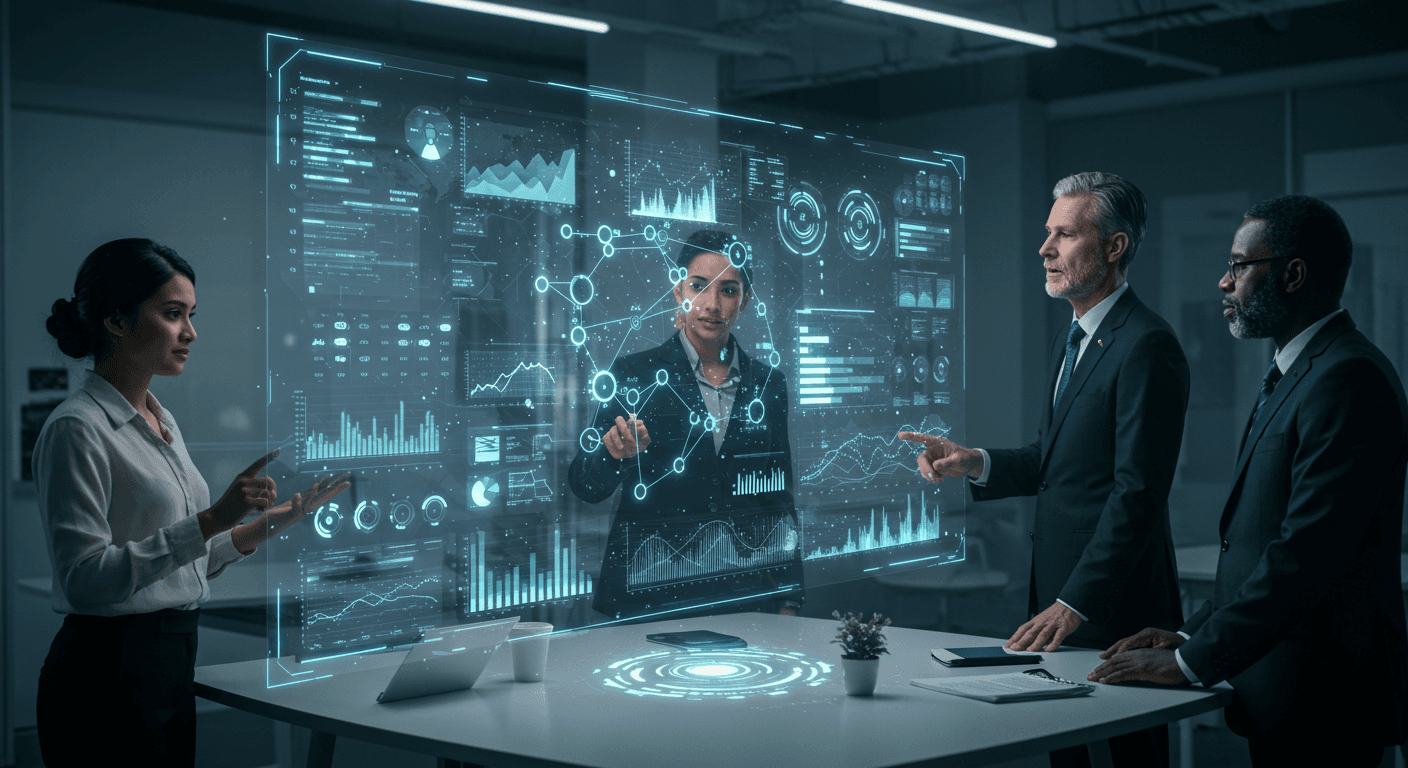
In today's fast-paced business environment, data is more than just numbers—it's the key to strategic decision-making. As Business Intelligence (BI) continues to evolve, the future of data visualization is set to redefine how companies interpret and leverage their data. Here are the trends shaping the future of data visualization in BI:
Interactive Dashboards
Static reports are becoming obsolete. Businesses demand dynamic, interactive dashboards that allow users to drill down into specific data points and customize views for deeper insights.AI-Driven Visualizations
Artificial Intelligence (AI) and machine learning are enhancing data visualization by automatically identifying patterns, trends, and anomalies, providing predictive insights with minimal manual effort.Real-Time Data Streaming
Real-time analytics is becoming a standard requirement. Data visualization tools are adapting to process and display live data, enabling businesses to make immediate, informed decisions.
Augmented Analytics
Augmented analytics combines natural language processing and AI to simplify data exploration. This empowers non-technical users to generate complex visualizations through simple queries.Mobile-First Design
With the rise of remote work, BI platforms are optimizing for mobile devices, ensuring that data visualizations are accessible anytime, anywhere, without compromising functionality.Data Storytelling
The future of BI emphasizes narrative-driven visualizations. Tools are focusing on creating compelling data stories that connect insights with business objectives, making data more relatable and actionable.
Conclusion:
The future of data visualization in business intelligence is about more than just aesthetics. It's about creating intuitive, real-time, and intelligent systems that turn raw data into clear, actionable insights. As these trends evolve, businesses equipped with advanced visualization tools like DataFlow will be better positioned to thrive in the data-driven landscape.